
B2B Site

Customers ask for high CRI LED for their plant growth projects at times, and sometimes this confuses us that why a well color rendered LED for human vision is also desired for plant growth?
In order to understand this, we process relevant experiments and calculations for analyzing the reason behind this requirement to figure out if it is meaningful.
Conclusions –
First, it is necessary to clarify and emphasize some basic concepts which will be mentioned and used.
CRI evaluates the ability of the light source that renders the original color of an object, with a full score of 100 (Ra), this metric picks Munsell test color samples, taking different illuminants as reference sources and comparing the chromatic aberration result under the test measured and reference light sources. The more aberration the lower color rendering scores. Taking the arithmetic mean value of the first 8 test color samples, we get the Ra as the general color rendering index, taking the 15 test color samples we get the extended color rendering index. In this calculation, tristimulus which is for the human eye’s adaption is also involved, CRI is a kind of visual perception.

Figure 1. 15 Munsell test color samples for CRI calculation.
Currently, on the market, we can find different CRI grade (Ra) LED products from generally 80 to 98. For the foreshadowing of the following content, we will talk a bit more regarding the method to improve CRI.
At the spectral level, there could be different recipes of phosphor combination to increase the CRI score, but the most effective and practical way is to enhance the long wave of the red spectrum. Figure 2 shows the comparison between Ra 80 and Ra 98, taking 3000K and 6000K spectra as examples. It can be concluded that shifting the red spectrum helps with increasing the CRI significantly.

Figure 2. Spectra of different CRI.
LED is famous for its remarkable energy-saving features compared to conventional light sources, and this also helps to win a Noble Prize. Energy-saving, from another perspective, means efficient. There are different measurements for efficiency and the luminous efficacy, which is a visual perception, is measured based on photopic vision with peak sensitivity at 555nm (Figure 3).

Figure 3. Human visual sensitivity.
According to the theory of calculating luminous flux, when other conditions are the same, the more the spectrum overlaps the photopic vision, the higher luminous efficacy can be obtained. This theory also answers that generally, high CRI LED is always lower luminous efficacy relatively.
Wall-plug efficiency evaluates the efficiency of converting electrical to optical power. Unlike to CRI, the WPE calculates the physical characteristic without any addition of visual perceptions. Understanding and analyzing WPE also help with calculating how to find a suitable heatsink.

Figure 4. The energy conversion process when LED works.
Photosynthetically active radiation defines the wavelength of 400nm - 700nm within which the photosynthesis corresponds most sensitively. It is similar to the human eye’s visual range, but the sensitivities are quite different (Figure 5).

Figure 5. Photosynthetic sensitivity.
The photosynthetic photon flux is the calculation based on the PAR, and essentially it is the photon generated by the light source in every second, measured with micromole (µmol), and the calculation involves the Avogadro's constant (Na = 6.022 × 10²³), Planckian constant (h = 4.14 × 10⁻¹⁵ eV∙s), light speed (c = 3 × 10⁸ m/s) and the spectral power distribution (discrete in a certain of nanometer intervals, measured as W/nm). Therefore, we can calculate the photosynthetic photon flux at each nanometer:

Obviously, all of the constants and variables used for calculating the PPF are “pure” physical values without extra photosynthetic or biological weightings. This also means that as long as there is a certain of spectral power distribution within the PAR, it is possible to get the same PPF whatever the shape of the spectrum.
It would be easy to calculate the photon efficacy when we have the photon flux, the PPE measures how efficiently the light source generates photons, with the based denominator of electrical power, the PPE is generally described as µmol/J (J = Joule, equals to W·s). Likewise, the calculation of PPE is about “pure” physical value. This is quite different from the calculation of luminous flux and efficacy.
In order to compare the experimental results equally, we try to make the conditions as same as possible, and the experimental conditions are based on:
The die and package are kept as the same (package 2835), considering the adjustment on CRI, which means the wavelength of the spectrum will be changed, the phosphor will be applied differently as well.
Test condition.
With the industrialized standard integrating sphere and spectrometer, with standard calibration procedure, the test condition is kept as constant to avoid any instrumental error.
As mentioned above, improving CRI is essentially about improving the spectral power distribution at the longer wavelength (600-650nm), and improving luminous efficacy, at the spectrum level, is to adjust the spectral power distribution within the photopic vision as far as possible. Therefore, in the following experiments with different spectrum design, the switch between CRI and luminous efficacy is considered as primary.
Accordingly, four different CRI experiments are processed to match the conditions above, they are Ra 95+, Ra 90+, Ra 85+ and Ra 80+, and pick the average result out of 10 samples to avoid bias effect, the list of optical parameters from the actual test is presented in figure 6.

Figure 6. Average test data of different CRI at 4000K, based on the same condition.
The result of the actual test matches the theory – with the improvement of CRI, the luminous flux and efficacy reduce gradually.
In Figure 7 (a) the four spectra are compared as normalized in the same coordinate axis. It can be found the peak wavelength of the red spectrum shifts to the right when increasing the Ra.
In Figure 7 (b) the absolute irradiances of Ra 80 and Ra 95 are compared in the same coordinate axis. Apparently, the irradiance of the blue peak of Ra 80 is stronger than Ra 95, this is because the longer wavelength of red phosphor absorbs more energy from the blue chip or the phosphors excited by the blue chip. Therefore, the energy from the spectrum is more evenly distributed.

Figure 7. Spectral comparison with different CRI.
As widely recognized, luminous flux is not suitable for assessing the performance for horticultural lighting because plants see different compared to a human, instead, the PPF and PPE should be adopted. According to the algorithm, the converted PPF and PPE are also presented in Figure 6.
Strangely, from Ra 80 to Ra 95, the luminous efficacy is different obviously, but the PPF and PPE are the same (considering the instrumental error during the tests), which means the CRI and luminous efficacy do not influence PPF and PPE, why?
As mentioned above, the experiments are kept as same conditions as possible, besides the same package 2835, the LED dies are the same as peak wavelength of 450nm, radiant power of 230mW, and phosphors used in the experiments are:
As introduced in the basic concepts, luminous flux and efficacy are visual perceptions for human eyes, the calculation of the flux is integral with the visual sensitivity as:

It can be concluded that the shape of the spectrum is one of the crucial factors affecting flux and efficacy. From Ra 80 to Ra 95, by reducing the distribution within the visual function, flux and efficacy are reduced synchronously. Figure 6 indicates these four LEDs generate similar radiant power (considering the instrumental error), but the results get different when converting to luminous flux.
An additional phenomenon of these different CRIs is that, as widely understood, long-wavelength spectrum mainly affects the rendition of saturated red color, which is R9 in the CRI 15 TCS (Test Color Samples), however, in these experiments apparently, the long-wavelength spectrum also affect the Ra – the average R1 to R8 significantly. Indeed, from the CRI results, R9 is the most variable parameter, from Ra 80 to Ra 95, R9 is calculated as -7.36, 19.12, 62.49 and 91.55 respectively. Figure 8 indicates the specific Ri from the four CRI LEDs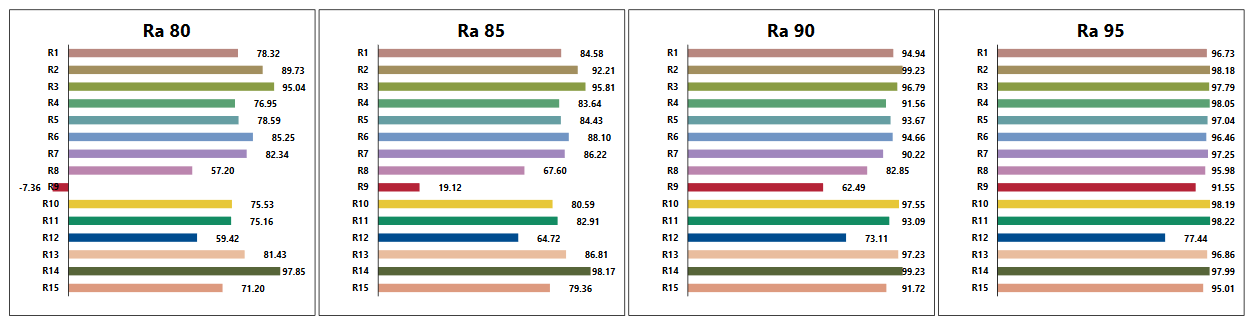
Figure 8. Specific Ri of different CRIs.
To explain this phenomenon, we could check with the reflectance factor of the CRI TCS 1-8 (Figure 9). From 600nm to 650nm, the TCS1 – 8 have the corresponding reflectance that fluctuates from 14.8% to 67.6%, which means the distribution within 600nm-650nm affects the TCS 1-8 effectively, that is to say the long-wavelength affects the Ra effectively.

Figure 9. The reflectance factors of CRI TCS 1 – 8.
As for PPF and PPE, although they start with “Photosynthetically” or ”Photosynthetic”, none of any specific botanical factor is involved in the calculation. Besides the relevant constants, the spectral power distribution , which essentially is the radiant power, determines the PPF and PPE. The process of energy conversion in this 4000K LED and relevant key factors that affect the conversion can be described as:

The experiments pick same LED die of 230mW radiant power, 450nm wavelength and 2.9V, and driving at 150mA, with the same EQE of green and red phosphors that are used for different CRI, which means all of the variables used for calculating the LED radiant power and PPF/PPE are the same, then we get this result and conclusion that CRI and luminous efficacy do not affect PPF and PPE, but remind that this conclusion is based on same experimental conditions – same constants and variables in the calculation, and based on the general recognition that improving CRI means improving the long-wavelength of the spectrum.
Although it is concluded that CRI and luminous efficacy do not affect the PPE, the calculation of PPF/PPE measures the amount of photon within the PAR, but this does not include the weighting of different photosynthetic sensitivities. Figure 10 indicates the comparisons of Ra 80 and Ra 95 spectra with the sensitivities of Chlorophyll a absorption, Chlorophyll b absorption, Phytochrome red (Pr) and Phytochrome far-red (Pfr), and the long-wavelength (>600nm) range which is the most different part between Ra 80 and Ra 95 is rendered in green and purple in Figure 10.


Figure 10. Comparisons of spectra and different photosynthetic sensitivities.
Apparently, the long-wavelength (>600nm) is involved in the peaks of photosynthetic sensitivities, and compare the different CRI spectra, the peak of Ra 95 is closer to the peaks of photosynthetic sensitivities, which means when considering the absorption of Chlorophyll a, Chlorophyll b, Pr and Pfr, high CRI spectra should perform better, and the “high CRI” is not based on a better visual color rendition, but is more sufficient spectral power distribution in long-wavelength (>600nm). As for the actual performance for specific plants at a specific growth stage, we leave this to the biologists.
Leave a comment